Clinic revenue analysis template
Keep one list of what the clinic sold, and read it by doctor, by room, by service and by where the patient came from. Set a period once and every sheet follows it.
Download
FreeNo sign-upDownloads directlyExcel and Google Sheets
What is inside
| Settings | Branches, rooms, doctors with their weekly hours, services with group, price and length, patient sources, payment methods, and the period to analyse. |
|---|---|
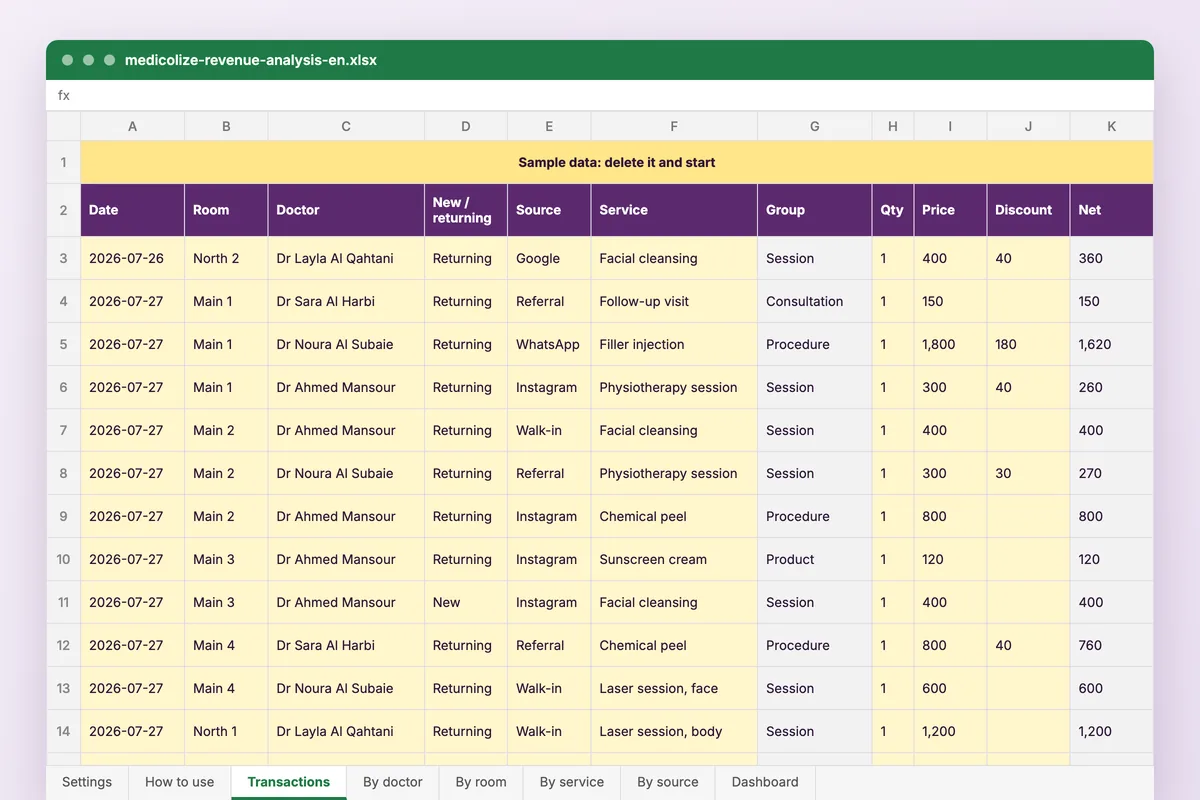
| Transactions | One row per service given: date, branch, room, doctor, patient code, new or returning, source, service, quantity, price, discount and payment method. |
| By doctor | Revenue, visits, average ticket and revenue per scheduled hour. |
| By room | Revenue per open day and an occupancy figure from the minutes booked. |
| By service | Count, revenue, share of the total and discount rate for each service. |
| By source | New patients and revenue from each source, month by month. |
| Dashboard | Six charts: weekly revenue, top 10 services, revenue per doctor hour, new and returning visits, revenue by source and the weekly discount rate. |
How to use it
Fill in Settings
Your rooms, doctors, services and sources, and the period to look at.
Add transactions
One row per service, or paste an export from your system.
Read the sheets
Each one answers a question: who, where, what and from which source.
Change the period
Type new dates on Settings and every sheet recalculates.
Who it is for
Owners and managers who want more than a monthly total: which doctor earns the most per hour, which room sits empty and which source brings patients who pay full price. It opens on 1,100 sample transactions from July to September. Instagram brings the most new patients with the deepest discounts, and a September promotion shows up on the discount chart.
Read next
Analytics
Financial, clinical and patient reporting that reconciles, across branches and specialties. Medicolize reports from the records, not from an export.
Read more From the blogRunning a data-driven clinic without a data team
Four numbers, checked weekly, will change more than a dashboard nobody opens. Here they are, and what each one is actually telling you.
Read moreMore free files
Questions
Does it work in Google Sheets?
Yes. Upload it to Google Drive and open it with Google Sheets. The sheets use SUMIFS, COUNTIFS, INDEX, MATCH and LARGE, and the charts carry over.
Can I change the currency?
Yes. Pick it once on the Settings sheet.
How is occupancy worked out?
From the minutes booked: each service has a length on Settings, and the minutes booked in a room are divided by its open days times the minutes it is available. It is a guide, not a timetable.
Is my data stored anywhere?
No. The file is yours, on your computer or your own Drive. Nothing you type reaches Medicolize.
The same questions, answered from the visit
Medicolize reads revenue by doctor, room, service and source from the visits and invoices already recorded, for any period, without copying a row. Thirty minutes on your own clinic.