Marketing
Where to spend, and where spending has produced nothing.
Most clinics can describe their catchment area from memory and are usually wrong about it. The addresses are already on the records. Plotted, they tell you where to advertise, where a second branch would work, and which patients are travelling further than they should have to.
Every patient record carries an area. Together they are a map of where the clinic actually draws from, rather than where you assume it does.
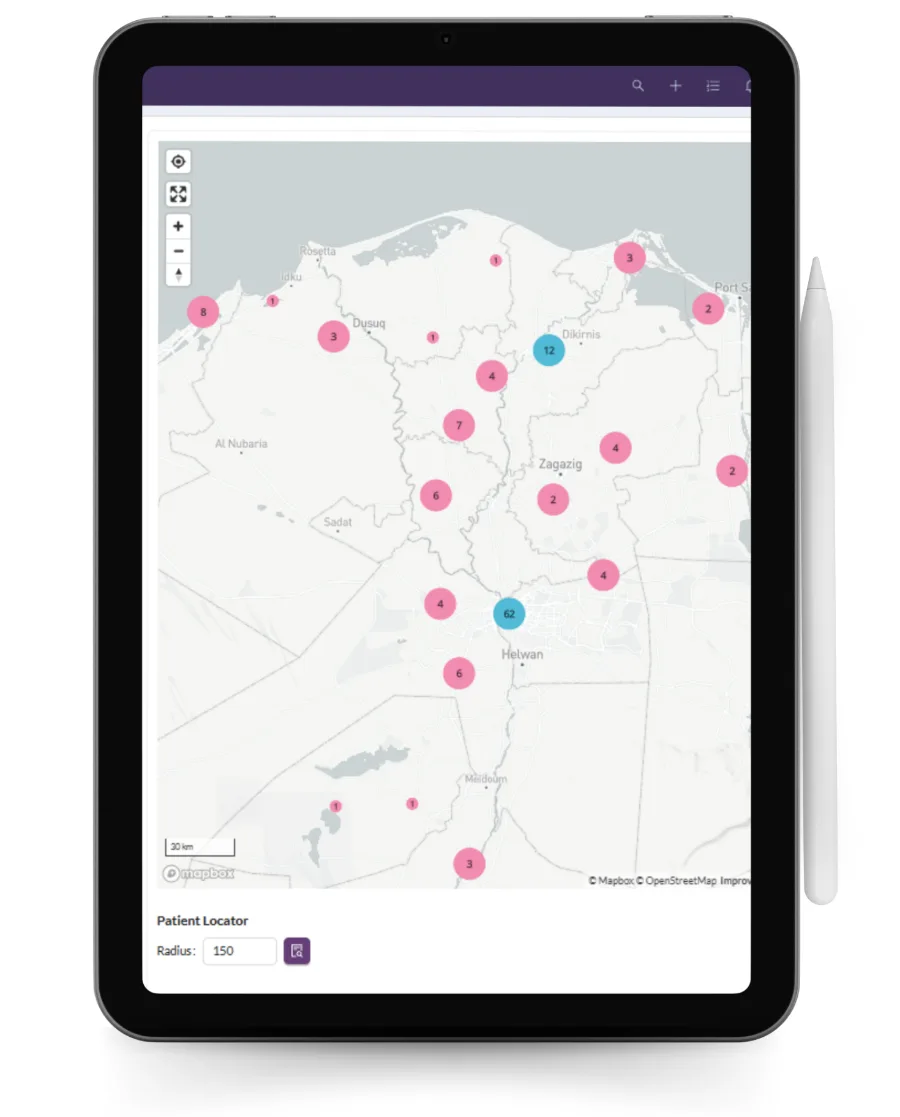
An area that produces a lot of first visits and no second ones is not a good area. The map is weighted by what happened after the first appointment.
In a group, the interesting number is how many patients are travelling past one of your own branches to reach another.
This is a planning number, but it changes what three different people do next week.
Where to spend, and where spending has produced nothing.
Which patients are travelling further than they need to.
Evidence for or against another location.
Both describe where patients come from. One of them is checkable.
The addresses already on your patient records. Nothing extra is collected and nothing is asked of the patient that you do not already ask.
Yes, and the comparison between branches is the useful part — particularly the patients travelling past one of your locations to reach another.
Yes. A dermatology patient will travel further than a physiotherapy patient who is coming twice a week, and averaging the two together hides both.
It tells you where there is demand you are already serving at a distance, which is the evidence a decision like that should rest on. The decision is still yours.
It is part of the patient record, so the same per-role access applies. The map is an aggregate view; opening an individual record still requires the permission to do so.
Enquiries from Instagram, WhatsApp and the website in one pipeline, with the source kept all the way to the course…
Read moreFinancial, clinical and patient reporting that reconciles, across branches and specialties. Medicolize reports from…
Read moreSearch, segment and follow up every patient the clinic has seen. Medicolize turns a patient list into something you…
Read moreHalf an hour on your own services, packages and price list. Someone calls you back within a day.