Owners
Profit by branch and department, without asking anyone to prepare it.
Revenue is the number most clinics know. Profit — by branch, by department, by doctor, after consumables and commission — is the number that decides things, and it is usually the one nobody can produce.
A busy department is not necessarily a profitable one. Cost of consumables, doctor commission, room time and overhead are applied against the revenue they belong to.
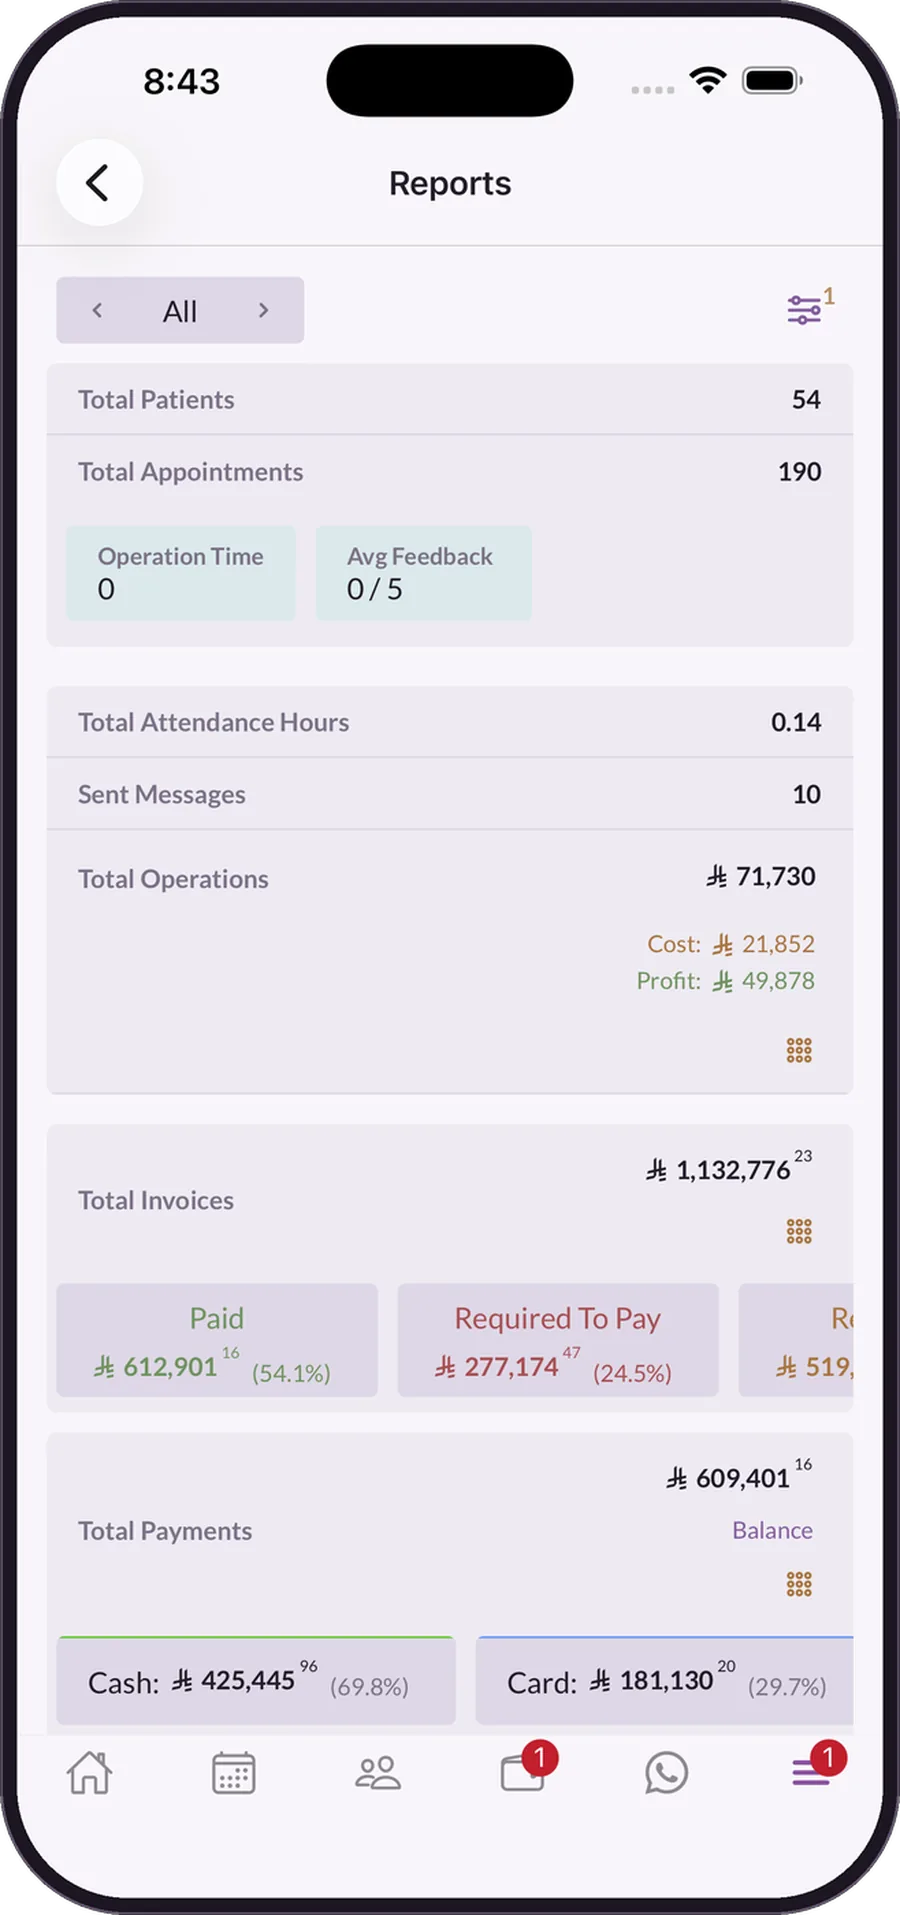
The dashboard is the first screen after login, not a report someone remembers to run. It moves as the clinic runs.
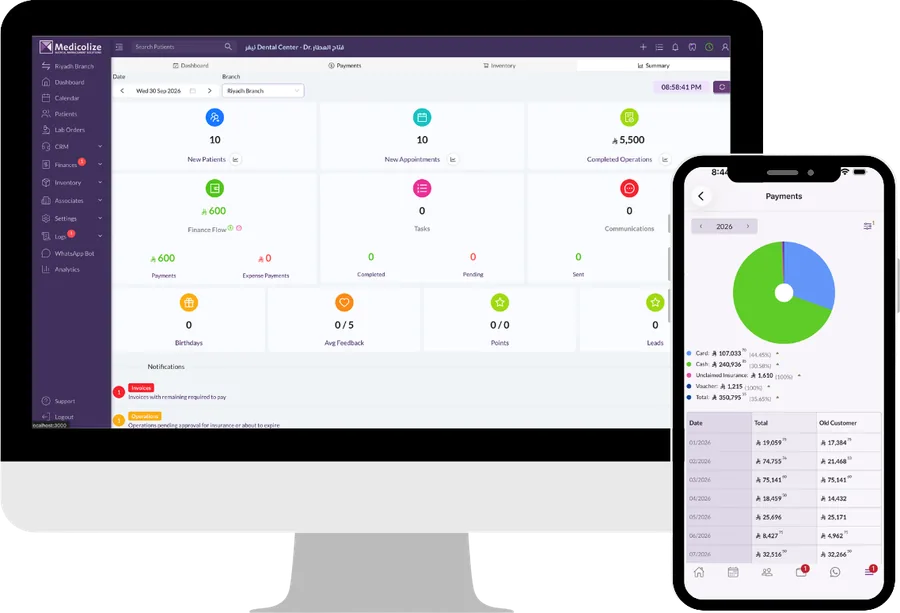
One month in isolation says very little. Periods, branches, departments and doctors are comparable side by side, on figures built the same way.
The same figures, at different resolutions.
Profit by branch and department, without asking anyone to prepare it.
Their own branch, their own utilisation, their own collection.
Production, completion and margin for their specialty.
The difference is whether you find out in time to do anything.
Revenue from delivered services, less the consumables actually consumed, doctor commission earned on those services, and the overhead allocated to that branch. Every component traces back to a record rather than to an assumption.
Yes. Access is per branch and per role, so a manager sees their own numbers and the owner sees all of them.
Yes, and for package-based clinics that distinction is the whole point. Payment for sessions not yet delivered is held as deferred until the session happens.
Yes, on identical measures — production, utilisation, margin and completion — which is what makes the comparison worth making.
Financial, clinical and patient reporting that reconciles, across branches and specialties. Medicolize reports from…
Read moreInvoices that build themselves from what was delivered, with packages, insurance share and expenses in one ledger.…
Read moreAttendance, permissions, commissions and payroll from the work actually recorded. Medicolize manages a clinic team…
Read moreHalf an hour on your own services, packages and price list. Someone calls you back within a day.