Clinic KPI dashboard template
Twelve numbers that tell an owner how the week went: occupancy, no-shows, waiting time, packages, receivables, claims and revenue per doctor hour. Type them once a week and read the dashboard in fifteen minutes.
Download
FreeNo sign-upDownloads directlyExcel and Google Sheets
What is inside
| Settings | Your doctors with their scheduled hours a week, and a green and a red mark for each indicator, with the direction that counts as better. |
|---|---|
| Weekly entry | One row per week, nineteen numbers. Each heading carries a note on where to find the number and what counts. |
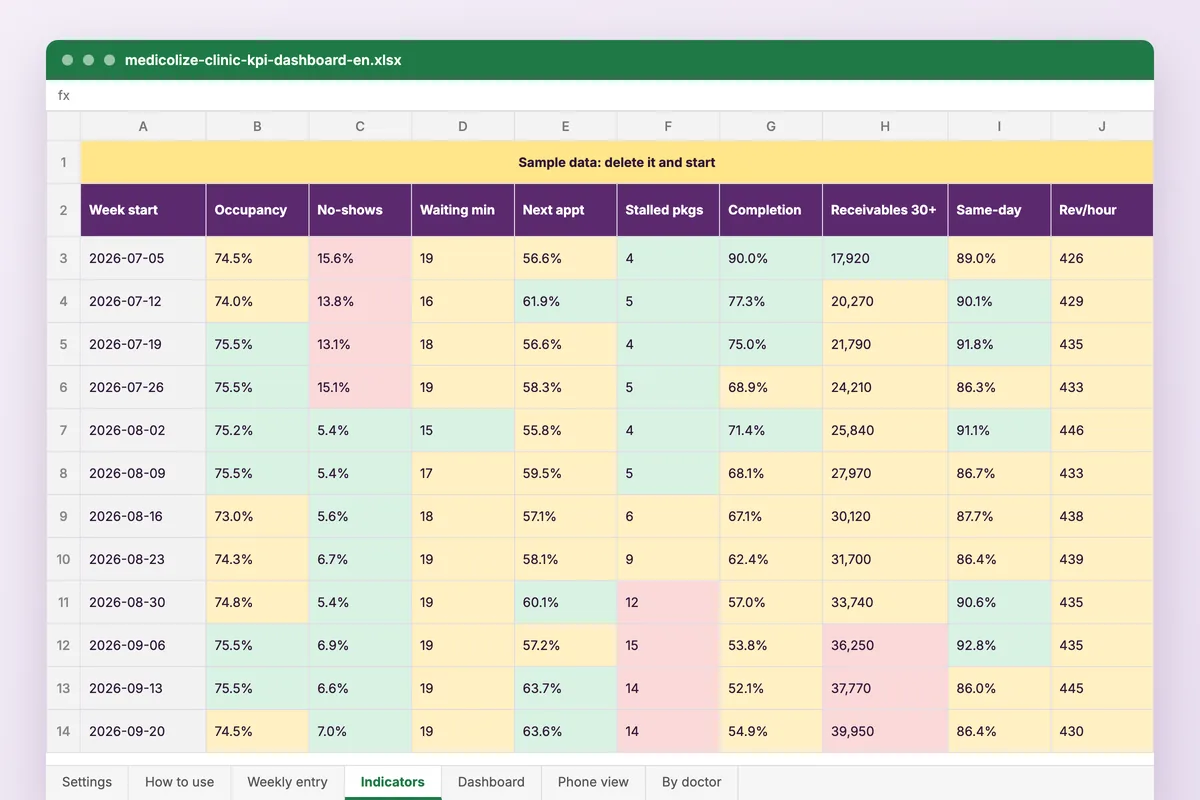
| Indicators | The twelve indicators worked out for every week, coloured green, amber or red against your marks. |
| Dashboard | Twelve tiles in a four by three grid: this week, last week, an arrow, an eight-week sparkline and the colour. Under the grid, three short lists: what to rescue this week, what needs a decision, and the trend. |
| Phone view | The same twelve numbers in one column, for reading on a phone. |
| By doctor | Booked and available slots, no-shows and revenue per doctor per week, ranked by revenue per scheduled hour, with occupancy and no-show rate beside it. |
How to use it
Set your doctors and marks
List the doctors with their weekly hours, and adjust the green and red marks if yours differ.
Enter the week
One row of nineteen numbers each week, and one row per doctor.
Read the dashboard
Start with the red tiles, then the three lists under the grid.
Look back
Type an earlier week at the top of the dashboard to see it as it was.
Who it is for
Owners and clinic managers who want one page on Sunday morning instead of five reports. The file opens on twelve sample weeks that already tell a story: no-shows fall after reminders start in week 5, stalled packages climb in weeks 8 to 10, receivables grow quietly all quarter, and one doctor earns the most per hour on 55% occupancy.
Read next
Analytics
Financial, clinical and patient reporting that reconciles, across branches and specialties. Medicolize reports from the records, not from an export.
Read more From the blogClinic KPIs: 12 numbers worth watching every week
Revenue is the number everyone looks at, and it is the last number to move. Weeks earlier, smaller numbers move: an empty slot, a stalled…
Read moreMore free files
Questions
Does it work in Google Sheets?
Yes. Upload it to Google Drive and open it with Google Sheets. The formulas are ones both handle, and the colours do not depend on anything Sheets lacks.
Can I change the currency?
Yes. The currency is one cell on the Settings sheet, with ر.س, ج.م, د.ك, د.إ and د.ب in the list. The money tiles show whichever you pick.
Is my data stored anywhere?
No. The file is yours, on your computer or your own Drive. Nothing you type reaches Medicolize.
Where do the targets come from?
The file ships with marks that suit many outpatient clinics, such as occupancy at 75% for green. They are yellow cells on Settings: set them to your own.
The dashboard without the Sunday typing
In Medicolize these twelve numbers fill themselves from the bookings, sessions and invoices the clinic already records, per branch and per doctor. Thirty minutes on your own clinic.